Did you know that it can take decades for a Nobel Prize winner of economics to properly test and demonstrate that their hypothesis is worthwhile?
This is because traditionally, finding correlations between different events has been painstaking, involving the work of creating and testing hypotheses that can take months or years. In our data-driven world, shouldn’t there a better way to find correlations between different types of data?
Now, thanks to the ability to crawl data on the web, there is. It can even be done in a way that can accurately predict disease, saving the lives of hundreds of thousands of people in Africa or a rise in the price of popular consumer electronic goods—like the iPad in 2011.
What was once painstaking work of experts can now be accomplished within mere seconds.
This post will see how this plays out with two examples using web data.
Thanks to the ability to crawl web data on the web, what was once the painstaking work of experts can now be accomplished within mere seconds.
Predicting and Preventing Outbreaks of Cholera
Cholera is a waterborne diarrheal disease that is known to be one of the leading causes of death in the developing world, leading to the deaths of hundreds of thousands of people. This is particularly tragic because treatment exists, even in these regions of the developing world where cholera is known to spread. But the challenge is in predicting exactly when a cholera outbreak will occur and preparing the healthcare system in that region accordingly. With a predictive modeling system based on proper news monitoring, however, we can even take it a step further: Hundreds of thousands of deaths a year can easily be prevented by simply allocating enough clean water to a specific region at the hour of need.
Why hasn’t this been done yet? Surely there have been epidemiologists working to predict cholera outbreaks, right? Well, although many epidemiological studies have attempted to predict cholera outbreaks around the world, they have had limited success. Why? For one, few actual studies have been conducted, so the research tends to be retrospective. Second, these epidemiological studies are limited in the amounts of data researchers can sift through manually.
Predictive modeling with computers, on the other hand, can crunch massive amounts of data to find far more connections between seemingly random events. The predictions also have the ability to be more accurate since computers can work with far larger sample sizes.
So how does it work?
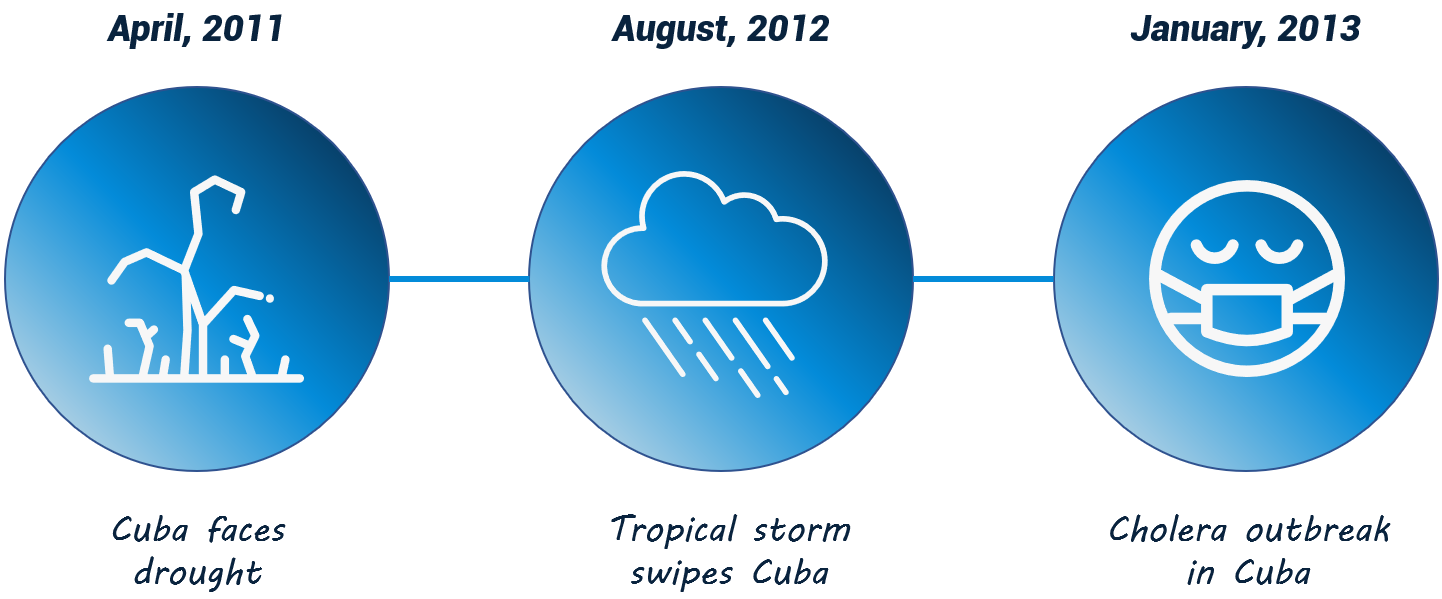
An algorithmic model was built by monitoring web news articles from a range of media sources for the last two decades to mine data to find events which could be later classified as predictors of the waterborne disease. After scanning these billions of news articles, the computer model searches to find keywords and phrases that correlate with the disease. The results were a strong correlation between cholera outbreaks in regions where there was a large drought followed by a large amount of rainfall, even if the two events occurred 2-3 years apart. This was particularly true of countries with low GDP and poor access to clean water.
Here’s a timeline of news articles that set off the alarm of the predictive model, accurately predicting the largest outbreak of cholera in Cuba in the last 130 years:

August 2012, Reuters, Topic storm Isaac drenches Haiti, swipes Cuba
After a century without the disease, Cuba fights to contain cholera, NBC January 2013
So even though we can’t prevent droughts or storms, we can help to prevent people from dying by monitoring web news data.
Linking Devastating Natural Disasters with a Rise in Prices
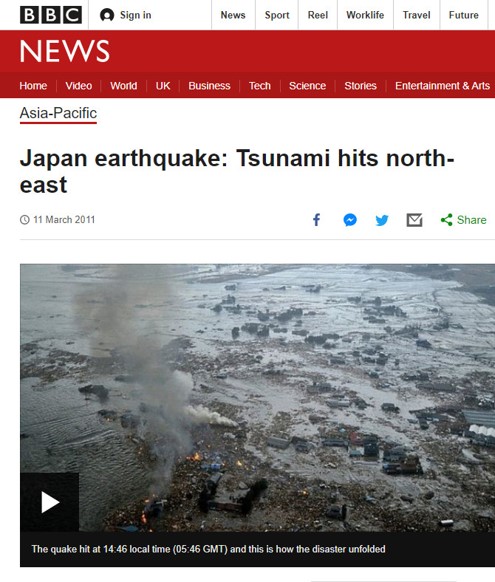
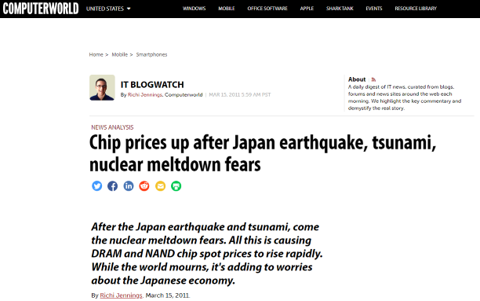
Web monitoring of news stories can also be used to identify a similar chain of events and its consequences, such as how the Tōhoku earthquake in Japan measuring 9.1 on the Richter scale and the resulting tsunami led to the rise in the price of the iPad2 in 2011.
The iPad2 just happened to go on sale on March 11, 2011, a few hours before the earthquake hit Japan. Japan supplies 40% of the world’s flash memory chips, including the NAND flash, a vital component of the iPad. Since many of Japan’s chip manufacturing companies are located in the main disaster area, the Tōhoku earthquake and tsunami significantly impacted the manufacturing of the NAND flash. (This NAND flash is then shipped to a specific factory in China which is the main manufacturer of iPads in the world).
The pattern the predictive algorithm was able to identify was:
Earthquake and tsunami in japan + hit in production of NAND flash
= Rise in price of iPad2


Although the mainstream media was able to connect the events fairly easily within a few days of the earthquake and tsunami, the predictive algorithm was able to do it immediately based on a combination of web news monitoring, text analysis, and an understanding that a shortage in supply often results in a price rise.
Predictive Algorithms Powered by Web Data
Many organizations have implemented predictive algorithms to forecast anything from the stock market prices to diagnosis of cancer. These two examples, however, are powered by web data, specifically the linking of a series of news articles from the web to causality. Today’s advanced web monitoring systems have the ability to monitor news in a more comprehensive manner as well as work with far larger sets of data than scientists have been able to in the past. The result is the ability to find connections between seemingly unrelated events, including stories that might seem unimportant at first glance, but provide valuable evidence in the context of a greater story. And with web data, we can finally understand these stories much sooner than ever before.


